


Biphasic glucose spikes after a meal refer to two distinct rises in blood sugar. The first is a quick spike from rapid carbohydrate absorption; the second, slower rise may result from delayed digestion (e.g., due to fat or protein) or continued glucose release from the liver.
It often signals a mixed meal and normal metabolic response, but exaggerated patterns can suggest impaired glucose regulation.
This article was first published in 2021. It has been medically checked and updated with new studies, and for readability.
Highlights
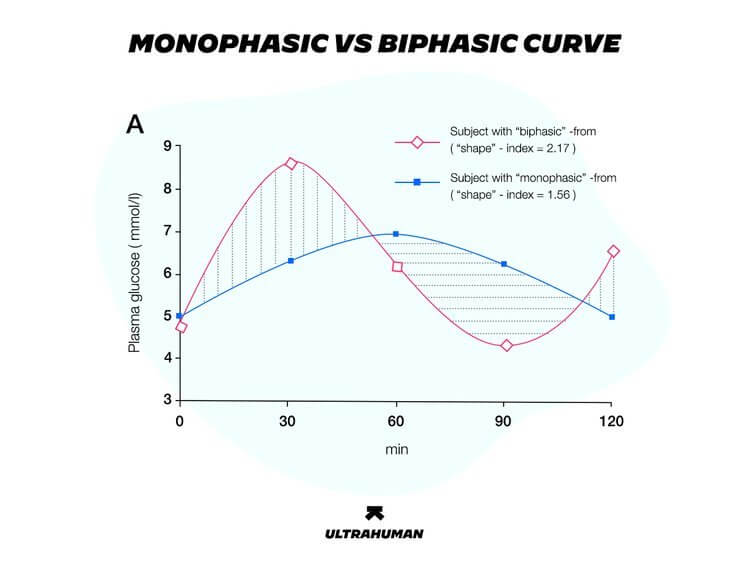
- A biphasic glucose curve shows a peak around 30–60 minutes after a meal, followed by a drop and a second rise 90–120 minutes later.
- A glucose tolerance test measures blood glucose levels after consuming 75 grams of glucose.
- Biphasic curves following a high-carb meal are linked to better health outcomes.
What are monophasic glucose spikes?
A monophasic glucose spike is a blood glucose pattern with a single peak that appears after a high-carbohydrate meal. The graph shows one rise, followed by a decline. This pattern can offer insight into your metabolic fitness.
What are biphasic glucose spikes?
A biphasic glucose curve is defined as a rise in blood glucose 30–60 minutes after eating, followed by a dip and then a second rise at around 90–120 minutes. Studies suggest that individuals with monophasic curves tend to have higher fasting and 2-hour glucose levels.
They also show lower insulin sensitivity, reduced beta-cell function (cells that produce insulin), and lower levels of HDL cholesterol (the “good” cholesterol), adiponectin (a hormone that helps regulate blood sugar and break down fat), and pancreatic polypeptide (which affects liver glycogen storage).
Overall, those with monophasic curves appear to have a higher prevalence of metabolic dysfunction and impaired glucose regulation.
Monophasic Glucose Spikes vs Biphasic Glucose Spikes
One study found that, after a glucose tolerance test, obese individuals with monophasic curves had lower insulin sensitivity and weaker pancreatic beta-cell function compared to those with biphasic curves. The monophasic group also had a higher likelihood of developing type 2 diabetes.
Another study looking at glucose curve shapes during an oral glucose tolerance test divided participants into monophasic and biphasic groups. Those with biphasic curves were more likely to have normal glucose tolerance. They were also younger, had lower BMIs, lower plasma glucose and HbA1c levels, and better insulin sensitivity than the monophasic group.
What is happening after glucose spikes
To understand these responses, it helps to look at the physiology behind them. In biphasic responders, insulin is quickly secreted by the pancreas right after glucose intake. This first phase is brief. The second phase, which lasts longer, accounts for the second peak in glucose.
In those with a monophasic curve, this insulin response seems to be blunted or delayed. As a result, glucose regulation is weaker, and the curve shows only one prolonged peak.
People with biphasic responses typically have more efficient insulin secretion and greater insulin sensitivity. This allows for early glucose uptake (first dip), followed by a second, delayed rise.
Other factors may influence the shape of the curve as well—such as the rate of gastric emptying and hormonal fluctuations. Still, biphasic curves after a carbohydrate-rich meal are generally associated with better outcomes.
They tend to correspond with lower glucose levels, reduced fasting insulin, lower BMI, and stronger insulin sensitivity. They’re also less commonly seen in people with glucose intolerance or metabolic syndrome.
That said, you don’t need to eat in a way that intentionally triggers a biphasic curve. In fact, the ideal post-meal glucose response is a smooth, stable line with minimal spikes. A flat or gently curved graph is a better sign of metabolic health than any kind of spike.

How does a glucose spike affect you?
Biphasic or monophasic responses are just one lens through which to view metabolic health. Repeated high spikes and crashes—especially after meals—can signal poor glucose control.
Ideally, your glucose curve should be steady, with few fluctuations and sustained within a healthy range.
Several factors beyond diet can also influence glucose spikes, including poor sleep, high stress, overeating, or inactivity. A continuous glucose monitor (CGM) can help you identify these patterns and optimize your metabolic response.
Summary
- A monophasic glucose spike has one peak and is often linked to lower insulin sensitivity, weaker beta-cell function, and higher metabolic risk.
- A biphasic curve features two rises and is typically associated with healthier glucose regulation.
- The most desirable curve is a flat or gently sloping one, with minimal spikes and crashes throughout the day.
Disclaimer: The contents of this article are for general information and educational purposes only. It neither provides any medical advice nor intends to substitute professional medical opinion on the treatment, diagnosis, prevention or alleviation of any disease, disorder or disability. Always consult with your doctor or qualified healthcare professional about your health condition and/or concerns and before undertaking a new health care regimen including making any dietary or lifestyle changes.
References
- Distinct metabolic profile according to the shape of the oral glucose tolerance test curve is related to whole glucose excursion: a cross-sectional study – PMC
- Glucotypes reveal new patterns of glucose dysregulation – PMC
- Assessing the Shape of the Glucose Curve During an Oral Glucose Tolerance Test | Diabetes Care
- The Shape of the Glucose Response Curve During an Oral Glucose Tolerance Test Heralds Biomarkers of Type 2 Diabetes Risk in Obese Youth – PMC